
- Mission Statement
- Background
- Henslow's Sparrow Report
- Objectives and Justification
- Partners in Flight High Priority Species
- General Vegetation Types and Data Sheets
- Size of Grassland
- Establishing Line Transects
- Sample Field Map
- Avian Surveys
- Vegetation Sampling
- JIZZ Descriptions and Species Codes
- Grassland Species in A.O.U. Check-list Order
- Suggested Reading
- Liability
- Acknowledgements and Miscellaneous
- Project Prairie Birds Release of Liability
 (PDF 271 KB)
 - Project Prairie Birds Release of Landowner Liability
(PDF 257 KB)
- Project Prairie Birds Vegetation Data Sheet
(PDF 254.8 KB)
- Project Prairie Birds Bird Survey Data Sheet
(PDF 254.9 KB)
- Project Prairie Birds Booklet without Species Photos
(PDF 2.7 MB)
Project Prairie Birds
A Citizen Science Project for Wintering Grassland Birds
Vegetation Sampling
- Measure vegetation after all avian surveys have been completed each season to minimize disturbance of birds occupying the transects (measure only once per year; or measure a few days before a prescribed burn is scheduled).
- Collect cover data with a 1 m square homemade “hula-hoop” made of 3/4” PVC connected with PVC elbows. From the staked and monumented starting point where avian surveys were conducted, toss the square to the left about one or two meters (see Figure 4). As the square lays flat (or as flat as possible), determine the percent composition (in multiples of 10) of the following cover: grass (standing alive or dead; includes sedges, rushes and reeds), forbs (these are broad-leaved herbaceous plants), woody shrubs, leaf litter (flattened, dead vegetation) and bare ground (includes soil or rock). Count the number of fire ant mounds and gopher mounds within the square. Determine the percent of the area in the square covered by water (not standing rainwater) and measure the average water depth. Alternate your tosses at each 25 m spot.
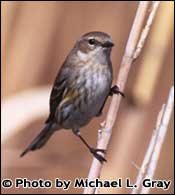
Yellow-rumped warbler
Photo Copyright Michael L. Gray
- To determine vertical thickness, use the Density Board Technique (see Figure 5).
- In wooded situations, record basal area of trees using a 1-factor metric prism (includes instructions) at each of the five toss sites. Place in one of the three different size classes depending on the diameter of the trees at breast height (4 1/2’ above ground). This will help to structurally describe the wooded conditions.
- Count the total number of woody shrubs, the total number of trees and the total number of snags (standing, dead trees) in the 20 x 100 m transect area.
Figure 4
Measure
vegetation along the same
transect line where avian
surveys were conducted.
Toss the square (“hula-hoop”)
a total of five times, once
every 25 meters, as seen
here.
Image showing where to measure vegetation along the transect line where the avian surveys were conducted as described above.
Figure 5
One
person should stand the
board up and hold it steady
in the center of the square
on every toss. A second
person, the observer, will
walk 15 meters due north
from the board, then turn
and face the board.
From a kneeling position, the observer will estimate the percentage (in multiples of 10) of the board that is obstructed by vegetation. The board should have a total of four equal sections, two painted black and two painted white, in an alternating fashion. This contrast aids in determining the amount of vegetation covering the board. In the example above, the first (bottom half-meter) section is 100% obstructed by vegetation. The second section is obstructed by 80% vegetation; this is how it should be scored on the vegetation data sheet.
Image showing the Density Board Technique as described above.
Project Prairie Birds Program
Texas Parks and Wildlife Department
4200 Smith School Road
Austin, TX 78744
or send a message to: nature@tpwd.state.tx.us