Freshwater Inflow Recommendation for the Trinity - San Jacinto Estuary
Introduction
Freshwater inflows (FWI) from rivers, streams, and local runoff maintain the salinity gradients, nutrient loadings, and sediment inputs that in combination produce an "ecologically sound and healthy estuary." This report summarizes TPWD studies of the FWI needed to maintain the unique biological communities and ecosystems characteristic of a "healthy" Galveston Estuary.
Methods for determination of the quantity and quality of freshwater inflows needed to maintain our coastal margins have been developed by the State Bays and Estuaries Research Program [consisting of the Texas Water Development Board (TWDB) and Texas Parks and Wildlife Department (TPWD)]. These determinations rely on computer optimization and hydrodynamic modeling to estimate minimum FWI (termed the MinQ flow) and maximum harvest FWI (termed MaxH flow) for each estuary (Fig. 1). In this report, the effectiveness of the MinQ and MaxH flows predicted by optimization modeling are critically evaluated. This analysis uses fisheries survey results from the TPWD Coastal Fisheries Resource Monitoring Database to validate the computer simulations. Observed abundances of estuarine fishery species are empirically evaluated against FWI regimes proposed from the theoretical models. Comparison of modeling results with observed fisheries survey data results in a FWI recommendation that will realistically maintain the "biological health and productivity" of the Galveston Estuary.
Review of TWDB/TPWD Modeling Results
The Estuarine Mathematical Programming or Optimization Model (TXEMP) produces a range of solutions that simultaneously predict seasonal (monthly) inflows, and the corresponding estuarine fishery harvests, which satisfy model constraints (Figs. 2A and 2B). These monthly inflows are constrained between the 10th and 50th percentile historical inflows (Table 1). Output from TXEMP serves as input to the two dimensional, finite element hydrodynamic circulation model (TXBLEND) which simulates patterns of salinity distributions and bay circulation.
Table 1. Monthly Inflow Bounds (as 10th and 50th percentile historical inflows) and predicted inflows for MinQ and MaxH Cases (in thousands of acre-feet).
Month |
Flow Bounds |
MinQ |
MaxH |
|
Percentile historic inflows |
10th | 50th | none | none |
January |
150.50 | 699.60 | 150.49 | 150.49 |
February |
155.20 | 946.50 | 216.69 | 155.19 |
March |
164.40 | 652.80 | 363.86 | 652.80 |
April |
193.90 | 632.50 | 352.55 | 632.50 |
May |
260.00 | 1273.70 | 679.66 | 1273.70 |
June |
190.30 | 838.70 | 448.07 | 839.70 |
July |
107.70 | 340.40 | 232.67 | 211.50 |
August |
78.00 | 225.30 | 153.99 | 139.97 |
September |
93.30 | 330.20 | 330.25 | 102.97 |
October |
49.90 | 251.90 | 251.90 | 78.54 |
November |
89.5 | 351.50 | 351.50 | 351.50 |
December |
93.90 | 626.80 | 626.80 | 626.80 |
Total |
4158.44 | 5215.67 | ||
Minimum and maximum annual inflow (MinQ and MaxQ) were computed to be 4.16 and 6.18 million acre-ft/year respectively. The model predicted that maximum fisheries harvest (MaxH) would occur at 5.22 million acre-ft/yr. Fig. 3 compares the monthly inflow distributions for MinQ and MaxH cases to two historical cases: the median (50th percentile) and 10th percentile flows (see also Table 1). Despite a large difference between MinQ and MaxH flows (ca 25 %), the difference in total fisheries harvest between the two cases (10.7 vs. 11.7 million pounds for MinQ vs. MaxH, respectively) is small (ca 9 %), with MaxH flow producing slightly higher harvests of blue crab, oysters, red drum, black drum and white shrimp.
TPWD Studies of Observed Biological Responses to Historical Freshwater Inflows
Two biological assessments were performed on the computed FWI targets: 1) Evaluation of the biotic suitability of seasonal salinity zones predicted from the hydrodynamic model; and 2) Correlating historical abundance of representative fisheries biota with observed seasonal salinity regimes (as a proxy for FWI).
Effects of MinQ vs. MaxH Salinity Regimes Predicted from Modeling
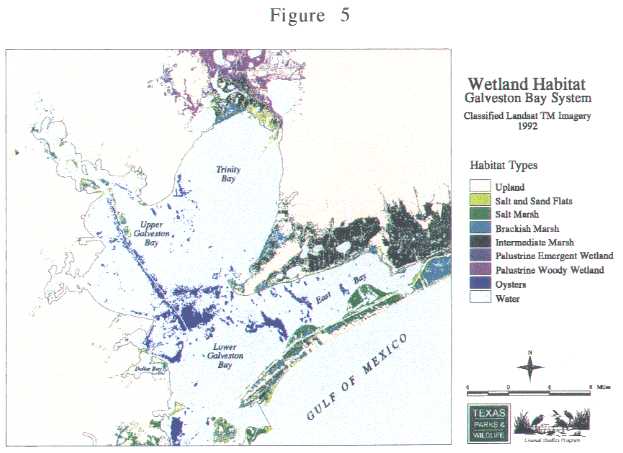
Geographic Information System (GIS) techniques were used to compare salinity maps from the hydrodynamic model under optimized MaxH or MinQ inflows. These maps were generated by contouring the salinities from each model run using Arc/Info GIS programs. Salinity change analysis was performed by overlaying MinQ and MaxH salinity maps for each month, thus producing salinity difference maps between MaxH and MinQ (Fig. 4). Locations of wetlands and oyster reefs were overlaid onto these monthly plots to determine impacts. (Fig. 5). The distribution of sensitive marsh wetlands in the Trinity Bay Delta region (552 ha of brackish marsh and 1,867 ha of intermediate marsh) were considered critical to this evaluation.
There were only small salinity differences (< 1.0 ppt) between MaxH and MinQ cases from January until April. In June, the largest salinity differences between the MaxH and MinQ cases were evident in the Middle and Lower parts of the Bay (Fig. 4).
Time Series Analysis of Salinity
Time-series analyses were performed on the salinity data from the TXBLEND model at selected sites in the Bay to determine when the salinity constraints would be exceeded (Fig. 6). The MinQ case had slightly higher average salinities but rarely exceeded the salinity constraints at any of the 12 positions tested in Trinity, Red Bluff, or Dollar Bays.
Because of the commercial importance of oyster production at locations in the middle of Galveston Bay, the annual salinity time-series was used to generate predictions of FWI effects on oysters and the oyster disease (Perkensis marinus). This disease has, at times, devastated oyster populations in Galveston. Little difference in oyster production due to salinity was predicted between the MaxH and MinQ cases. However, owing to Perkensis sensitivity to low salinities, the prevalence and duration of the disease was less in the MaxH case (e.g. Fig. 7). This small difference in disease prevalence could, in turn, result in large differences in annual oyster harvest in Galveston Bay.
Spatial Analysis of Preferred Salinity Zones for Target Fauna Using Coastal Fisheries Catch Data
Table 2 lists the characteristics and source of the fisheries data, as well as analytical methods used in deriving preferred salinity zones. GIS spatial analyses helped to demonstrate the preferred salinity zones for the seven target species: white and brown shrimp, blue crab, Gulf menhaden, Atlantic croaker, bay anchovy, and pinfish. The TPWD fisheries database from 1982 to 1993 was used to derive spatial correlations between salinity and the relative catch (CPUE) of each species. GIS overlays were then developed for trawl catch rates and salinity zones using the Coastal Fisheries database. This allowed us to determine the actual preferred salinity zone from the abundance of young animals caught in otter trawls and the salinity distribution within the Estuary (see examples in Fig. 8, Fig. 9, and Fig. 10). From the Arc/Info GIS plots, two critical data values for each species were calculated: 1) the percent abundance of animals in bay salinity zones, and 2) the percent of bay area occupied by that salinity zone. Correlations between salinity zone area and relative abundance allowed salinity preference zones (where peak density occurred) to be derived for each species.
Fisheries Data Source and Methodology used for deriving Preferred Salinity Zones.
TPWD Coastal Fisheries Database
- Long-term Sampling Program (since late 70's)
- 20 Trawl Samples per Month in each Estuary
- Hydrographic Parameters Collected Simultaneously
Target Species Analyzed
- White Shrimp
- Blue Crab
- Brown Shrimp
- Atlantic Croaker
- Gulf Menhaden
- Bay Anchovy
- Pinfish
Analysis Techniques
- Spatial Correlation (Geographic Information System)
- Contouring Kriging)
- Statistics (Nonparametric, ANOVA)
Table 3. Preferred Salinity Zone Area under Three Inflow Regimes
Target Species |
Preferred Salinity Zone (ppt) |
Observed Sample Case (% Bay Area) |
Min Q Case (% Bay Area) |
Max H Case (% Bay Area) |
White Shrimp |
10 - 15 | 32.2 | 21.9 | 23.7 |
Brown Shrimp |
10 - 20 | 44.3 | 37.4 | 30.4 |
Blue Crab |
0 - 15 | 60.8 | 48.1 | 60.5 |
Gulf Menhaden |
10 - 15 | 37.0 | 21.3 | 22.5 |
Atlantic Croaker |
None | None | None | None |
Bay Anchovy |
10 - 20 | 50.1 | 39.3 | 35.8 |
Pinfish |
20 - 25 | 26.8 | 13.8 | 15.7 |
Comparison of MinQ and MaxH Flows to Historical Inflow Levels
When the frequencies of historical inflows (1941 to 1990) are compared to the MinQ and MaxH levels (Fig. 3), the frequencies of inflow under both the MinQ and MaxH cases appear considerably reduced relative to average or median flows into Galveston Bay. Although the MaxH flow has been shown to be protective of the target species, much of this is dependent on the critical seasonal timing of these flows. However, at these minimal flows, small reduction in MaxH flows during the late spring and early summer could affect oyster harvest (e.g. Fig.7) through enhanced prevalence of the oyster disease. Juvenile forms of several other fishery species may also be affected by less than MaxH seasonal flows
Inflow Recommendation Summary
TPWD staff recommends MaxH (5.22 million acre-ft/yr) inflows as the lowest FWI target value which generally fulfills the biological needs of the Galveston Estuary on a seasonal basis. TPWD prefers the conservative value of MaxH which provides conditions closer to the salinity preferences of the target species and protects the oyster fishery from disease (P. marinus). This is in contrast to the MinQ case (4.16 million ac-ft per yr). The distribution of MaxH flows approximating the historical monthly median pattern provides the most adequate salinity conditions during the critical spring months of May and June. Dryer conditions during summer months (July and August) may be expected naturally and can be tolerated if the estuary is provided with adequate inflows earlier in the year.