Perspective
Statewide surveys were initiated in 1978 to monitor quail populations — historical survey data, 1978 to 2024. This index uses randomly selected, 20-mile roadside survey lines to determine annual quail population trends by ecological region. Comparisons can be made between the mean (average) number of quail seen per route this year and the 15-year mean for each ecological region. The following sections provide an overview of populations and habitat throughout the state, as well as trend and survey data by ecological region from 2010 to 2024.
Search for quail hunting opportunities on public and leased land with an Annual Public Hunting Permit.
Scaled Quail Season Overview
Overview — Coming off a strong showing in 2023, scaled quail populations cooled down this year as the state’s stronghold regions struggled for timely and sufficient rainfall. This led to delayed nesting attempts in most counties and despite a mid-season push, birds were already behind come late summer. On the positive side, biologists reported good carryover from last year and were still observing pairs into early September. This means that while we likely didn’t build off back-to-back strong years, we also didn’t lose significant ground. Habitat conditions will be the barometer by which we measure future production in these areas, but birds are holding tight for now. We expect good opportunities this season, diminishing in quality as we push into late winter.
As a reminder, our surveys are only designed to provide a representation of bobwhite populations at the regional level and local conditions may vary considerably. If you would like to learn more about this season’s hunting prospects and the outlook for your area of interest, connecting with one of our regional TPWD biologists is a great way to help plan your hunt. Best of luck to all this season!
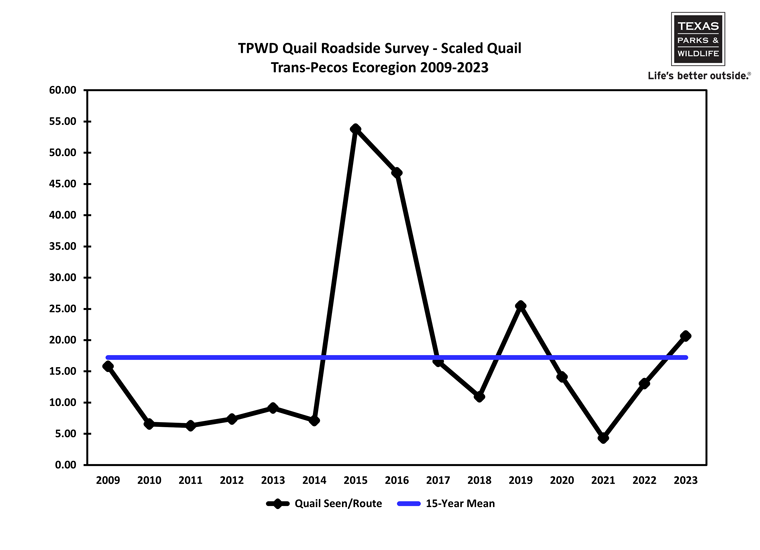
Trans-Pecos Forecast
- Survey Results — average number of scaled quail seen per route was 20.12 compared to 20.65 last year; this count was above the 15-year mean of 17.49, holding steady for a second year.
- Regional Outlook — habitat conditions weren’t favorable to start the year with limited early season rainfall. This translated to few nesting attempts and put birds in an early hole. Nesting reports picked up as summer got underway, with birds still observed in pairs through August, giving hope for a late season push. Good carryover was reported across the region, including on both our WMAs, but we didn’t see any expansion in numbers and expect recruitment was low. As such, we are expecting average hunting opportunities for the region.
-
2023-24 Harvest Report: Hunters = 741; Days = 676; Harvest = 5,925
Lower than expected, likely due to low reporting rate in 2024 (<5 respondents) - 5-Year Harvest Average (2019-2023): Hunters = 1,740; Days = 6,379; Harvest = 20,928
Edwards Plateau Forecast
- Survey Results — average number of scaled quail seen per route was 6.38 compared to 4.50 last year; this count was above the 15-year mean of 5.73, and continuation of a 2-year trend.
- Regional Outlook — habitat conditions varied across the region, aligned with summer rainfall patterns. Much like bobwhites, scaled quail were able to take advantage locally and added to their numbers for a third straight year. These gains have been incremental and while the region likely doesn’t have the habitat capacity at this point for large increases, it remains a huntable region for scaled quail. As such, we expect average hunting opportunities.
- 2023-24 Harvest Report: Hunters = 1,111; Days = 2,365; Harvest = 5,266
- 5-Year Harvest Average (2019-2023): Hunters = 1,858; Days = 6,941; Harvest = 13,128.
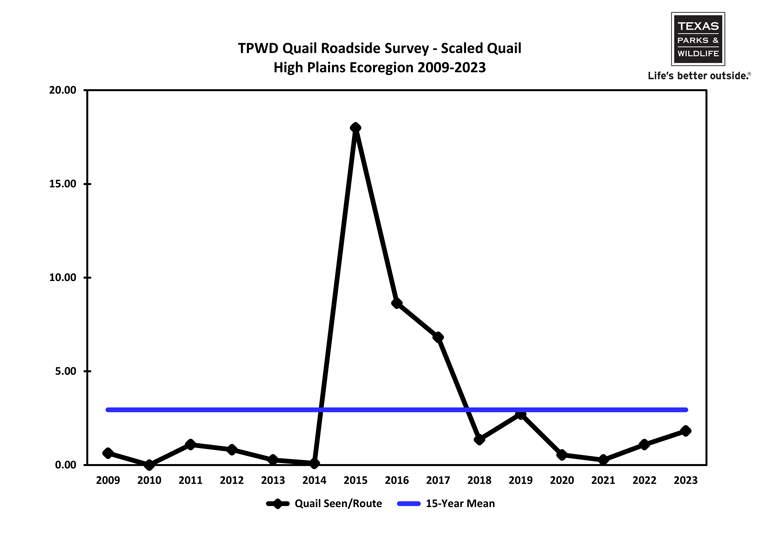
High Plains Forecast
- Survey Results — average number of scaled quail seen per route was 3.83 compared to 1.67 last year; this count was above the 15-year mean of 2.91, and continuation of a 2-year trend.
- Regional Outlook — habitat conditions were favorable to begin the spring, with heavy rainfall in parts of the southern Panhandle. Moving into summer the region dried out and while there was a slight delay in brood sightings through June, reports of paired birds were an encouraging sign. Reduced population numbers in past years have resulted in fewer hens being available for nesting, but we did observe a bump this year, indicative of a slow yet steady recovery. Like the Edwards Plateau, birds increased in numbers in this region for a third straight year. Our biologists are optimistic and anticipate average hunting opportunities this season.
- 2023-24 Harvest Report: Hunters = 3,333; Days = 7,094; Harvest = 25,015
- 5-Year Harvest Average (2019-2023): Hunters = 1,914; Days = 5,867; Harvest = 19,399
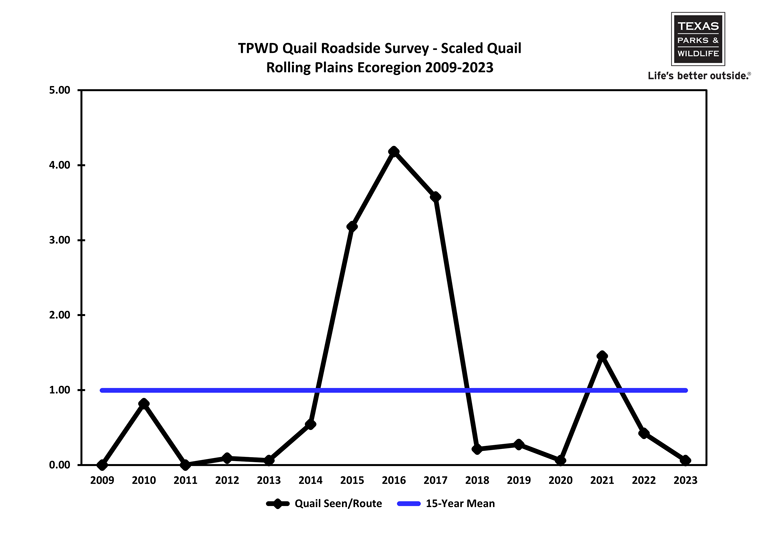
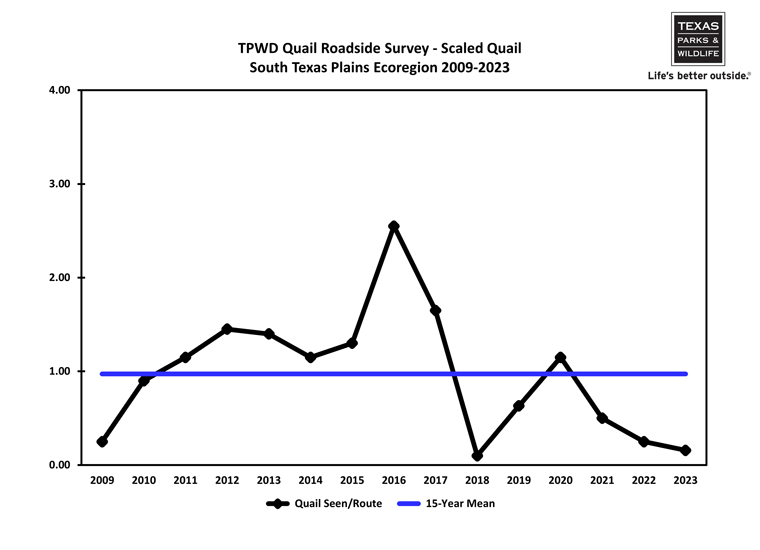
Other Ecoregions
Scaled quail in both the Rolling Plains and South Texas Plains persist at relatively low densities, with populations struggling to regain their footing over the last 10 years. Habitat condition improvements in both regions bode well for occasional encounters and opportunities, but strong numbers will be limited to large, intact grasslands and thornscrub. As always, there will be pockets where these birds are doing well and might buck any regional trends. However, we generally expect below average hunting opportunities this season for both regions.
Scaled Quail 15-Year Trend Data
| Year | Edwards Plateau | High Plains | Rolling Plains | South Texas Plains | Trans-Pecos |
|---|---|---|---|---|---|
| 2010 | 2.88 | 0.00 | 0.82 | 0.90 | 6.56 |
| 2011 | 1.25 | 1.00 | 0.00 | 1.15 | 6.31 |
| 2012 | 5.63 | 0.75 | 0.09 | 1.45 | 7.38 |
| 2013 | 0.25 | 0.25 | 0.06 | 1.40 | 9.13 |
| 2014 | 2.25 | 0.08 | 0.55 | 1.15 | 7.13 |
| 2015 | 5.13 | 16.36 | 3.18 | 1.30 | 53.79 |
| 2016 | 18.38 | 7.92 | 4.18 | 2.55 | 46.80 |
| 2017 | 24.75 | 6.25 | 3.58 | 1.65 | 16.60 |
| 2018 | 3.50 | 1.25 | 0.21 | 0.10 | 10.93 |
| 2019 | 1.50 | 2.50 | 0.27 | 0.63 | 25.47 |
| 2020 | 0.88 | 0.50 | 0.06 | 1.15 | 14.13 |
| 2021 | 7.13 | 0.25 | 1.45 | 0.50 | 4.33 |
| 2022 | 1.50 | 1.00 | 0.42 | 0.25 | 13.06 |
| 2023 | 4.50 | 1.67 | 0.06 | 0.16 | 20.65 |
| 2024 | 6.38 | 3.83 | 1.55 | 0.58 | 20.12 |
| 15-Year Mean | 5.73 | 2.91 | 1.10 | 0.99 | 17.49 |
Scaled Quail Survey Data by Ecoregion
Edwards Plateau
The average number of scaled quail seen per route was 6.38 compared to 4.50 last year. This was slightly above the 15-year mean of 5.73. Limited public hunting opportunities are available through our Annual Public Hunting Permit. As always, scouting ahead and contacting your local biologist are good strategies to ensure a quality experience.
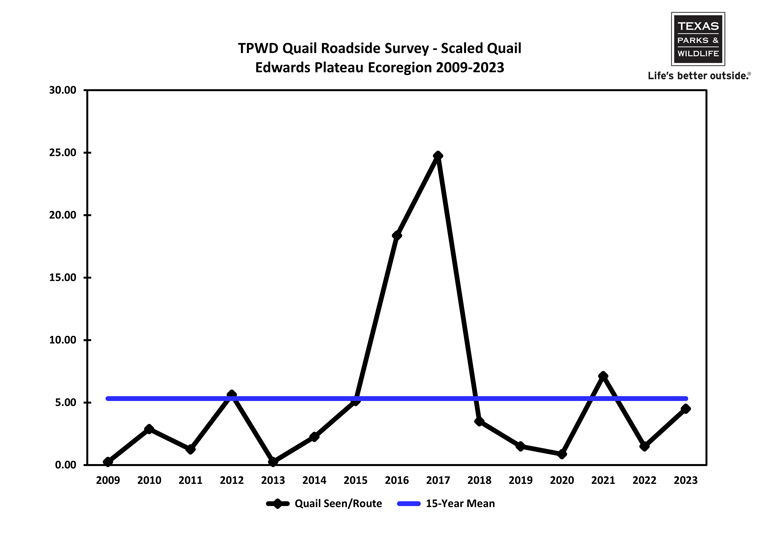
Line graph illustration of the TPWD quail roadside survey results for the Edwards Plateau Ecoregion from 2010 to 2024. The mean (average) number of scaled quail seen per route for each year is represented by the black line. The 15-year mean (average) is represented by the blue line.