Perspective
Statewide surveys were initiated in 1978 to monitor quail populations — historical survey data, 1978 to 2025. This index uses randomly selected, 20-mile roadside survey lines to determine annual quail population trends by ecological region. Comparisons can be made between the mean (average) number of quail seen per route this year and the 15-year mean for each ecological region. The following sections provide an overview of populations and habitat throughout the state, as well as trend and survey data by ecological region from 2011 to 2025.
Search for quail hunting opportunities on public and leased land with an Annual Public Hunting Permit.
Bobwhite Quail Season Overview
Overview — With reports of good carryover throughout the state, many were optimistic about bobwhite populations heading into the spring. Good habitat conditions and above average rainfall provided for improved nesting and brood rearing habitat across most of the bobwhite range. Although bobwhite populations in the Rolling Plains appear to be similar to last year, reports suggest many areas in this ecoregion have above average bobwhite numbers. South Texas remains a stronghold and bobwhite populations appear to increase the further south you go within this region. Highlighting regional improvements, biologists are reporting good bobwhite observations in Brooks, Hall, Kenedy, Shackelford, and Willacy counties. Expectations are high based on the quality conditions and we anticipate good hunting opportunities going into the 2025-26 season.
As a reminder, our surveys are only designed to provide a representation of bobwhite populations at the regional level and local conditions may vary considerably. If you would like to learn more about this season's hunting prospects and the outlook for your area of interest, connecting with one of our regional TPWD biologists is a great way to help plan your hunt. Best of luck to all this season!
Cross Timbers Forecast
- Survey Results — average number of bobwhites seen per route was 0.94 compared to 1.37 last year; this count was below the 15-year mean of 1.41, and a slight decrease from 2024.
- 2024-25 Harvest Report*: Hunters = 529; Days = 1,213; Harvest = 488
- 5-Year Harvest Average (2020-2024): Hunters = 557; Days = 2,326; Harvest = 5,578
Edwards Plateau Forecast
- Survey Results — average number of bobwhites seen per route was 1.28 compared to 3.39 last year; this count was below the 15-year mean of 2.91, and a decrease from 2024.
- 2024-25 Harvest Report*: Hunters = 3,175; Days = 17,945; Harvest = 30,508
- 5-Year Harvest Average (2020-2024): Hunters = 2,266; Days = 10,792; Harvest = 14,842
Gulf Coast Prairies Forecast
- Survey Results — average number of bobwhites seen per route was 4.40 compared to 5.30 last year; this count was below the 15-year mean of 7.78, and a slight decrease from 2024.
- 2024-25 Harvest Report*: Hunters = 794; Days = 1,698; Harvest = 7,566
- 5-Year Harvest Average (2020-2024): Hunters = 673; Days = 3,358; Harvest = 9,080
High Plains Forecast
- Survey Results — average number of bobwhites seen per route was 4.44 compared to 3.78 last year; this count was below the 15-year mean of 6.44, but a slight increase from 2024.
- 2024-25 Harvest Report*: Hunters = 2,645; Days = 12,368; Harvest = 33,193
- 5-Year Harvest Average (2020-2024): Hunters = 1,559; Days = 5,470; Harvest = 13,655
Rolling Plains Forecast
- Survey Results — average number of bobwhites seen per route was 15.32 compared to 16.50 last year; this count was above the 15-year mean of 12.23, and a slight decrease from 2024.
- 2024-25 Harvest Report*: Hunters = 9,788; Days = 40,255; Harvest = 135,700
- 5-Year Harvest Average (2020-2024): Hunters = 7,200; Days = 35,811; Harvest = 53,720
South Texas Forecast
- Survey Results — average number of bobwhites seen per route was 12.70 compared to 9.13 last year; this count was above the 15-year mean of 9.78 and a welcome increase from 2024.
- 2024-25 Harvest Report*: Hunters = 20,370; Days = 78,086; Harvest = 291,658
- 5-Year Harvest Average (2020-2024): Hunters = 18,281; Days = 75,326; Harvest = 250,397
Bobwhite Quail 15-Year Trend Data
| Year | Cross Timbers | Edwards Plateau | Gulf Prairies | High Plains | Rolling Plains | South Texas Plains |
|---|---|---|---|---|---|---|
| 2011 | 2.06 | 1.06 | 19.44 | 1.78 | 5.32 | 8.03 |
| 2012 | 0.23 | 5.13 | 8.00 | 0.11 | 3.48 | 7.74 |
| 2013 | 0.60 | 1.13 | 9.70 | 0.78 | 2.80 | 6.13 |
| 2014 | 1.34 | 4.81 | 19.90 | 5.89 | 7.52 | 13.77 |
| 2015 | 1.06 | 6.44 | 14.90 | 15.00 | 38.84 | 24.55 |
| 2016 | 6.14 | 11.67 | 4.60 | 33.22 | 52.52 | 13.97 |
| 2017 | 4.03 | 4.17 | 7.30 | 9.22 | 23.16 | 10.16 |
| 2018 | 0.17 | 0.83 | 1.30 | 9.22 | 3.66 | 5.06 |
| 2019 | 0.40 | 0.94 | 2.33 | 4.11 | 5.34 | 13.77 |
| 2020 | 1.83 | 0.72 | 3.00 | 2.56 | 3.25 | 3.77 |
| 2021 | 0.51 | 1.00 | 4.40 | 2.33 | 1.50 | 3.10 |
| 2022 | 0.23 | 0.11 | 2.50 | 0.78 | 0.86 | 5.26 |
| 2023 | 0.20 | 1.00 | 9.60 | 3.44 | 3.43 | 9.59 |
| 2024 | 1.37 | 3.39 | 5.30 | 3.78 | 16.50 | 9.13 |
| 2025 | 0.94 | 1.28 | 4.40 | 4.44 | 15.32 | 12.70 |
| 15-Year Mean | 1.41 | 2.91 | 7.78 | 6.44 | 12.23 | 9.78 |
Bobwhite Quail Survey Data by Ecoregion
Cross Timbers and Prairies
The average number of bobwhites seen per route was 0.94 compared to 1.37 last year. This was below the 15-year mean of 1.41. Limited public hunting opportunities are available through our Annual Public Hunting Permit. As always, scouting ahead and contacting your local biologist are good strategies to ensure a quality experience.
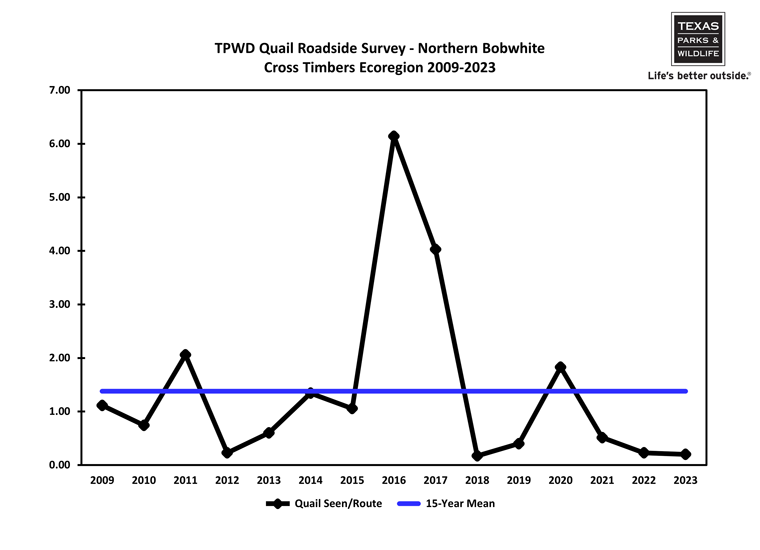
Line graph illustration of the TPWD quail roadside survey results for the Cross Timbers Ecoregion from 2011 to 2025. The mean (average) number of bobwhite quail seen per route for each year is represented by the black line. The 15-year mean (average) is represented by the blue line.
Edwards Plateau
The average number of bobwhites seen per route was 1.28 compared to 3.39 last year. This was below the 15-year mean of 2.91. Limited public hunting opportunities are available through our Annual Public Hunting Permit. As always, scouting ahead and contacting your local biologist are good strategies to ensure a quality experience.
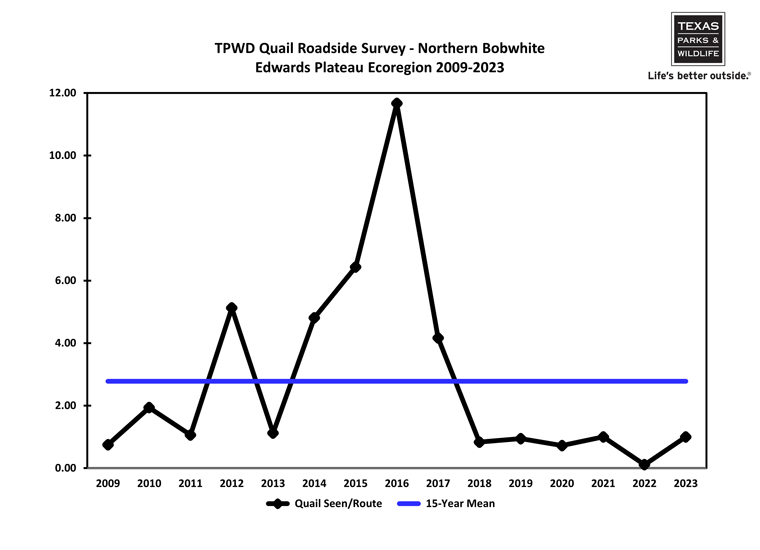
Line graph illustration of the TPWD quail roadside survey results for the Edwards Plateau Ecoregion from 2011 to 2025. The mean (average) number of bobwhite quail seen per route for each year is represented by the black line. The 15-year mean (average) is represented by the blue line.
Gulf Prairies
The average number of bobwhites seen per route was 4.40 compared to 5.30 last year. This was below the 15-year mean of 7.78. Limited public hunting opportunities are available through our Annual Public Hunting Permit. As always, scouting ahead and contacting your local biologist are good strategies to ensure a quality experience.
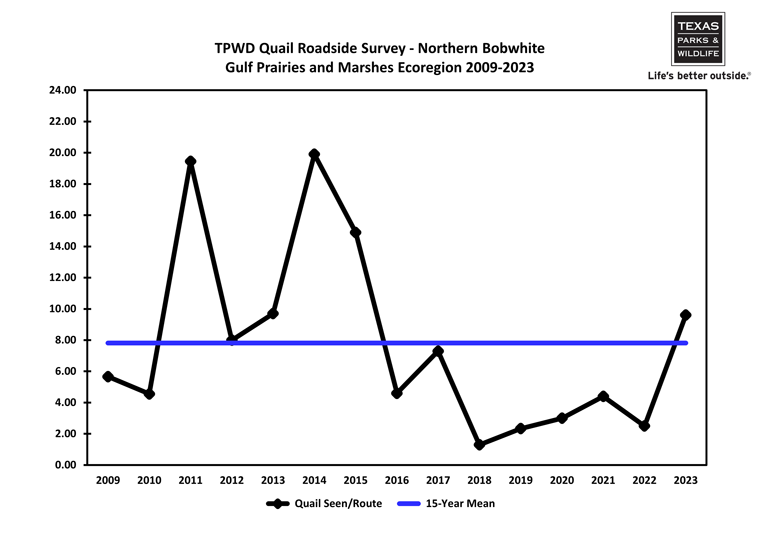
Line graph illustration of the TPWD quail roadside survey results for the Gulf Prairies Ecoregion from 2011 to 2025. The mean (average) number of bobwhite quail seen per route for each year is represented by the black line. The 15-year mean (average) is represented by the blue line.
High Plains
The average number of bobwhites seen per route was 4.44 compared to 3.78 last year. This was below the 15-year mean of 6.44. Public hunting opportunities are available through our Annual Public Hunting Permit. As always, scouting ahead and contacting your local biologist are good strategies to ensure a quality experience.
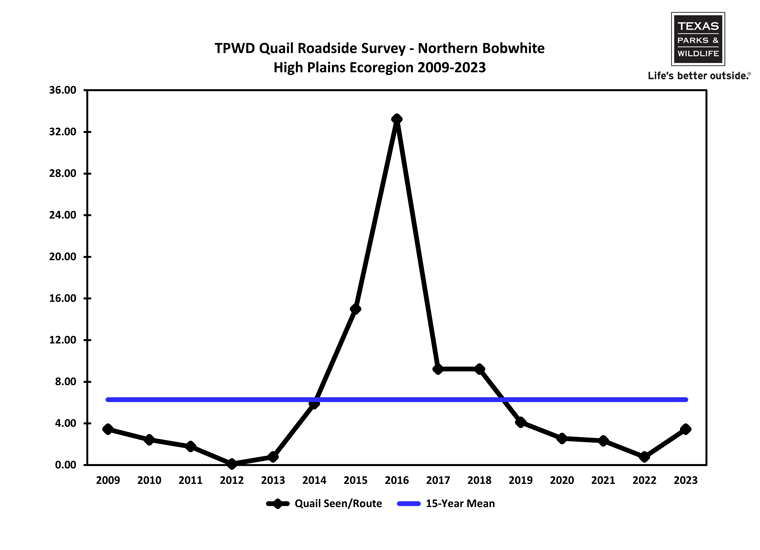
Line graph illustration of the TPWD quail roadside survey results for the High Plains Ecoregion from 2011 to 2025. The mean (average) number of bobwhite quail seen per route for each year is represented by the black line. The 15-year mean (average) is represented by the blue line.
Rolling Plains
The average number of bobwhites seen per route was 15.32 compared to 16.50 last year. This was above the 15-year mean of 12.23. Public hunting opportunities can be found at the Gene Howe and Matador and Teacup Mountain Wildlife Management Areas (WMA). Teacup Mountain WMA is new for the 2025-26 Quail Season and biologists are reporting good quail numbers. We expect these WMAs to provide good hunting opportunities this season. For the fifth year in a row TPWD is offering a Private Lands Quail Hunt in Lipscomb County - applications are due October 15th. Additional hunting opportunities are available through our Annual Public Hunting Permit. As always, scouting ahead and contacting your local biologist are good strategies to ensure a quality experience.
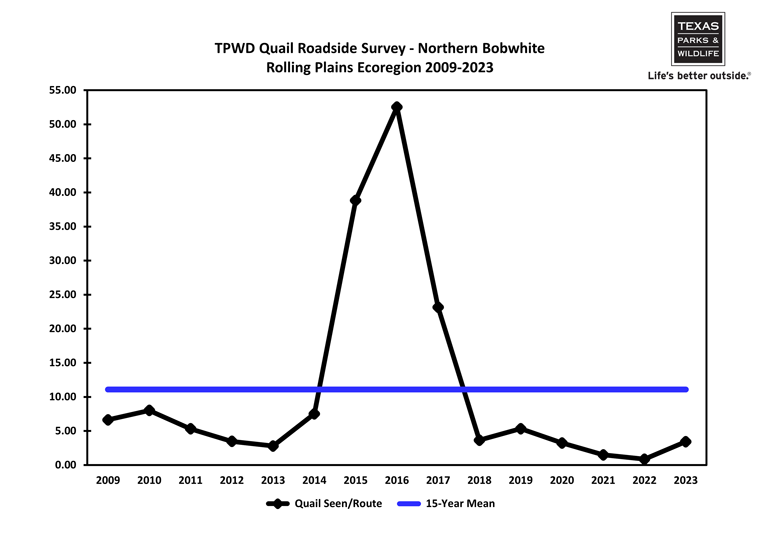
Line graph illustration of the TPWD quail roadside survey results for the Rolling Plains Ecoregion from 2011 to 2025. The mean (average) number of bobwhite quail seen per route for each year is represented by the black line. The 15-year mean (average) is represented by the blue line.
South Texas Plains
The average number of bobwhites seen per route was 12.70 compared to 9.13 last year. This was above the 15-year mean of 9.78. Public hunting opportunities can be found at the Chaparral and James E. Daughtrey Wildlife Management Areas (WMA). We expect these WMAs to provide fair hunting conditions. Additional hunting opportunities are available through our Annual Public Hunting Permit. As always, scouting ahead and contacting your local biologist are good strategies to ensure a quality experience.
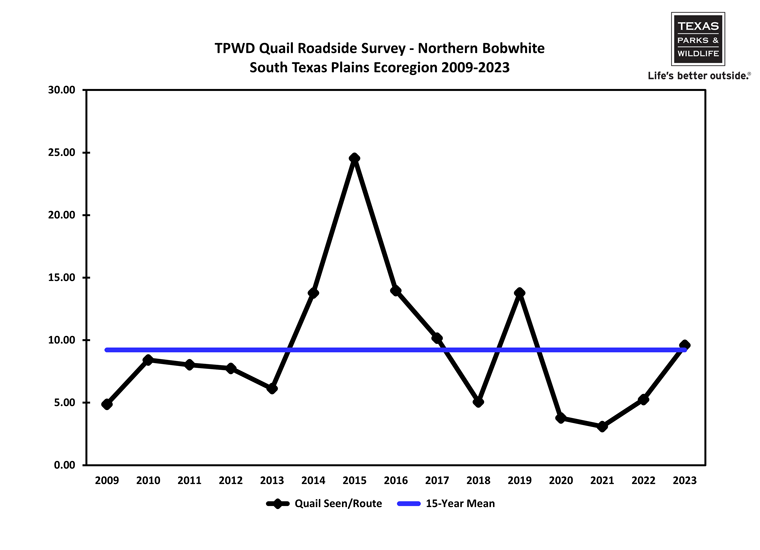
Line graph illustration of the TPWD quail roadside survey results for the South Texas Plains Ecoregion from 2011 to 2025. The mean (average) number of bobwhite quail seen per route for each year is represented by the black line. The 15-year mean (average) is represented by the blue line.