 (
(Texas Horned Lizard Watch 10-Year Summary Report
Results – Trends
While results of Texas Horned Lizard Watch have shed some light on distribution patterns and on the effects of habitat variables, survey results have not managed to reveal a trend in horned lizard populations over the ten years of the survey. Density estimates from transects conducted by volunteers do not reveal trends in horned lizard or ant abundance. During the first year of the watch, application of quantitative survey techniques was not standardized—leading to large variances in results (table 1). In subsequent years most volunteers chose to not conduct the more standardized and quantitative transects, leading to small sample sizes. Resulting data do not indicate a clear trend in densities.
| Year | n | Zero Values | Min. | Max. | Mean | St. Dev. |
|---|---|---|---|---|---|---|
| 1997 | 86 | 43 | 0.330 | 436.00 | 15.68 | 56.61 |
| 1998 | 11 | 3 | 0.035 | 4.89 | 0.82 | 1.40 |
| 1999 | 17 | 6 | 0.170 | 8.42 | 1.26 | 2.02 |
| 2000 | 6 | 3 | 1.020 | 3.33 | 1.03 | 1.35 |
| 2001 | 7 | 2 | 0.080 | 1.38 | 0.50 | 0.49 |
| 2002 | 8 | 0 | 0.230 | 9.00 | 2.79 | 3.06 |
| 2003 | 5 | 2 | 0.890 | 2.41 | 0.97 | 1.04 |
| 2004 | 4 | 2 | 1.030 | 2.22 | 0.81 | 1.06 |
| 2005 | 3 | 0 | 1.030 | 3.48 | 2.39 | 1.25 |
| 2006 | 6 | 2 | 0.340 | 1.74 | 0.65 | 0.73 |
Qualitative data also do not provide insight into trends. Only three sites have been monitored continuously since 1997, with no change in presence or absence noted at these sites. Because there is a high turnover in volunteer participation, in 2007 a mail survey was conducted, seeking updated data on 162 monitoring sites that were established in 1997–99. Volunteers were asked if they had revisited the sites within the last three years and whether horned lizards had been seen at the site. Responses were received for 66 sites, with updated sighting data provided for 47 sites. Only 13 sites reported that their results had changed in the last decade, with 11 of the 13 reporting horned lizards were originally present but now absent. Some geographic patterns may be evident (fig. 12), but sample sizes are too small to draw definite conclusions. When asked their opinions about trends, 40 percent of the original participants thought THL were decreasing, 24 percent thought populations were stable, 16 percent thought they had increased, and 20 percent were unsure.
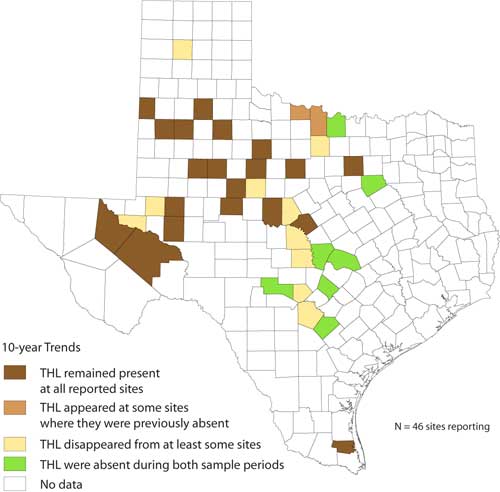
Figure 12. Trends in horned lizard sightings, Texas Horned Lizard Watch, 1997–1999 vs. 2005–2007
Finally, in an effort to increase sample sizes for recent years, in 2007 an email survey of Texas Parks and Wildlife Department wildlife biologists was conducted. The biologists were asked if they had seen a horned lizard in their counties of responsibility in the past three years. Results showed a definite geographic break, with no sightings in the eastern third of Texas (except for some coastal counties) and sightings in nearly every county of West and South Texas (with the exception of the southern edge of the Edwards Plateau). While results corroborate positive volunteer results in West and South Texas, they failed to confirm the positive volunteer findings in the Post Oak Savannah and the Dallas/Fort Worth area. Horned lizard populations may be so small and scattered in these counties that encountering them is unlikely unless a person lives in those specific habitat areas.
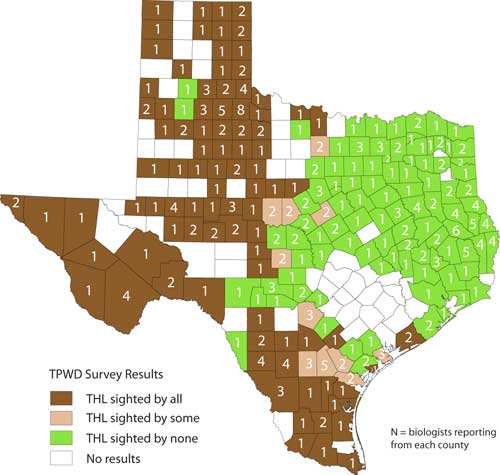
Figure 13. Occurrence of Texas Horned Lizard sightings by TPWD biologists, 2004-2006
Top of Page^