Technology for Fisheries Management
Josh Harper, Matagorda Bay Fishery Biologist
In high school, I hated math and utterly despised computers. In fact, the only class I ever came close to failing was word processing. While the rest of the class were blazing away at 60 words per minute, I was still struggling with quick red foxes jumping lazy dogs. However, I loved fishing and biology. So, it made sense that I should study fisheries science and leave math and computer stuff to others. Now here I sit, a fisheries biologist for the State of Texas, crunching fish numbers on my computer. Little did I know what a large role space-age technology would play in modern fisheries management.
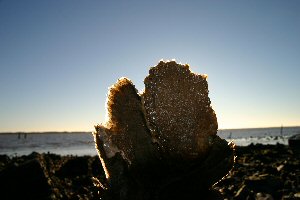
Take oysters for example. The oyster industry is big business in Texas and pumps a tremendous amount of money into our coastal economy. Additionally, oyster beds provide habitat for many popular sport fishes. Consequently, recreational fishermen come to fish on oyster reefs and bring in even more cash. In short, almost everyone on the coast has a vested interest in having healthy oyster reefs and to monitor those reefs, we need good maps
Unfortunately, having good maps is easier said than done. An excellent oyster map of Lavaca Bay was produced in 1913 by Moore and Danglade, but it wasn't easy. For months, they kept a large crew rowing around the bay, poling for oysters, sampling them with tongs and taking their location by triangulating using flags set on the shoreline. Then there were more months with a cartographer hand-drawing the maps. When the Texas Parks and Wildlife Department (TPWD) set out to produce a new map, we wanted something quicker and less labor intensive. Fortunately there is a side-scan Sonar.
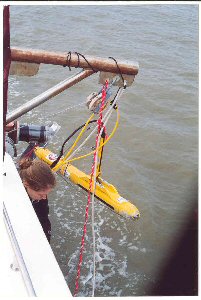
A side-scan sonar looks like a torpedo and is towed several feet off the bay bottom behind a boat. It projects soundwaves over approximately 100 yards of seafloor. If those soundwaves encounter a hard object (metal, wood, rock, oyster reef, etc.), they are reflected back to be recorded by the instrument. Soundwaves that hit soft bottom are absorbed into the mud or sand. From the reflected soundwaves or lack of them, the side–scan produces acoustic images that are similar in appearance to black and white aerial photographs. White represents hard bottom, black represents oozy mud, and many shades of grey represent varying densities of bottom.
Fans of TV's nautical archaeology documentaries are doubtless already familiar with side–scan. Treasure hunters are regularly dragging them around the world in search of lost battleships and sunken Spanish galleons. However, in the last few years, side–scan technology has developed to the point that we can discern much finer detail about the ocean floor. In 2002, TPWD, in partnership with Texas A&M University at Galveston, used side–scan Sonar to remap the oyster reefs of Lavaca Bay. With side–scan, clumps of oysters as small as one square yard were discernible — and of course, we always keep our eyes open for Jean Lafitte's treasure or sunken German U–boats.
Also on our research vessel was a device called a sub-bottom profiler, more affectionately known as "The Chirp" because of the sound it makes. The chirp, towed alongside the side–scan, is another type of sonar, but designed to look beneath the seafloor. By firing soundwaves straight down, the chirp produces a cross-sectional image very similar to a recreational fishfinder, but penetrating nearly 100 ft beneath the bay bottom. From this image we can detect ancient oyster reefs buried by years of sediment. We can find the old Lavaca River channel from tens of thousands of years ago when sea levels were lower and the river had to flow much farther before reaching saltwater. We can also see changes in sediment layering indicative of historical hurricane strikes.
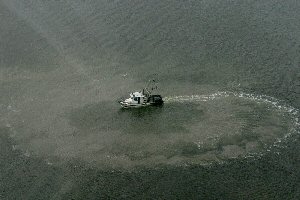
Unfortunately, the side–scan and sub–bottom profiler images alone do not make a map. The equipment was towed in parallel lines across the bay, much like a tractor plowing a field. However, the computers that are processing the data produce one long straight line image with no turns. At this point, we turn to the GPS, that wonderful technological gift from our military.
In a simplified explanation, GPS, or Global Positioning System, consists of two parts. The first consists of 24 satellites orbiting the earth. The second is the portable receivers carried by people wanting to know their location. The satellites above the earth are essentially highly accurate clocks. They continually broadcast microwave time signals to the portable receivers. Depending on the distance, these microwave signals vary in their travel time from satellite to the receiver. The receivers measure the miniscule differences in time (which converts to distance) among the satellite signals and that tells them how far away they are from a given satellite. Once at least three of these distances are known, the GPS receiver can calculate coordinates for its position on earth.
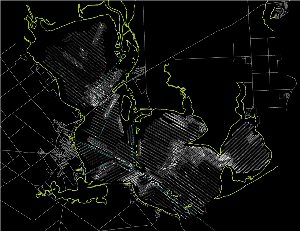
All of our sonar equipment was synchronized with a GPS receiver so that every point of data we collected has a corresponding latitude and longitude. This allows the images to be correctly positioned to produce a large mosaic of the seafloor. Though neat to look at, these images are of limited use. They must be transformed into maps that are easy to interpret. To do that we rely on multiple Geographic Information Systems (GIS) software packages.
GIS allows users to combine vast amounts of geographic data and produce maps incorporating all of it. With our side–scan images, we are able to draw shapes to delineate reefs. These shapes can be placed in regular maps to show reef locations — useful to biologists, oystermen, and recreational fishermen. However, GIS is capable of far more interesting applications. For example, if we have a hypothetical fish that likes oyster reef habitats, salinities of 15-20 ppt, and depths of 2–4 ft, we can input our map of oyster reefs, a table of salinity measurements with coordinates, and a NOAA bathymetric chart. The GIS will then churn out a map showing ideal habitats for our fish.
At TPWD, we are charged by the citizens of Texas to protect out natural resources based on the best available information. Throughout history, the "best" continues to improve with technological advances and it is our duty to keep up with those advances. Whether it is better sampling gear, improved computer software, or cutting–edge satellite information, TPWD plans to use it to ensure the future of Texas's coastal habitats. For more information contact josh.harper@tpwd.texas.gov
© Copyright Texas Parks and Wildlife Department. No part of this work may be copied, reproduced, or translated in any form or medium without the prior written consent of Texas Parks Wildlife Department except where specifically noted. If you want to use these articles, see Site Policies.